August 1, 2025
Building AI-Native Research Infrastructure: The Odyssey Vision
Dylan Goldblatt, Ph.D.
Office of Research
Kennesaw State University
Overview
- Supporting Research Missions
- AI-Native Approach
- Thoughtful Design, Real Impact
- Outcomes and Optimizations
- Your Voice in Shaping the Future
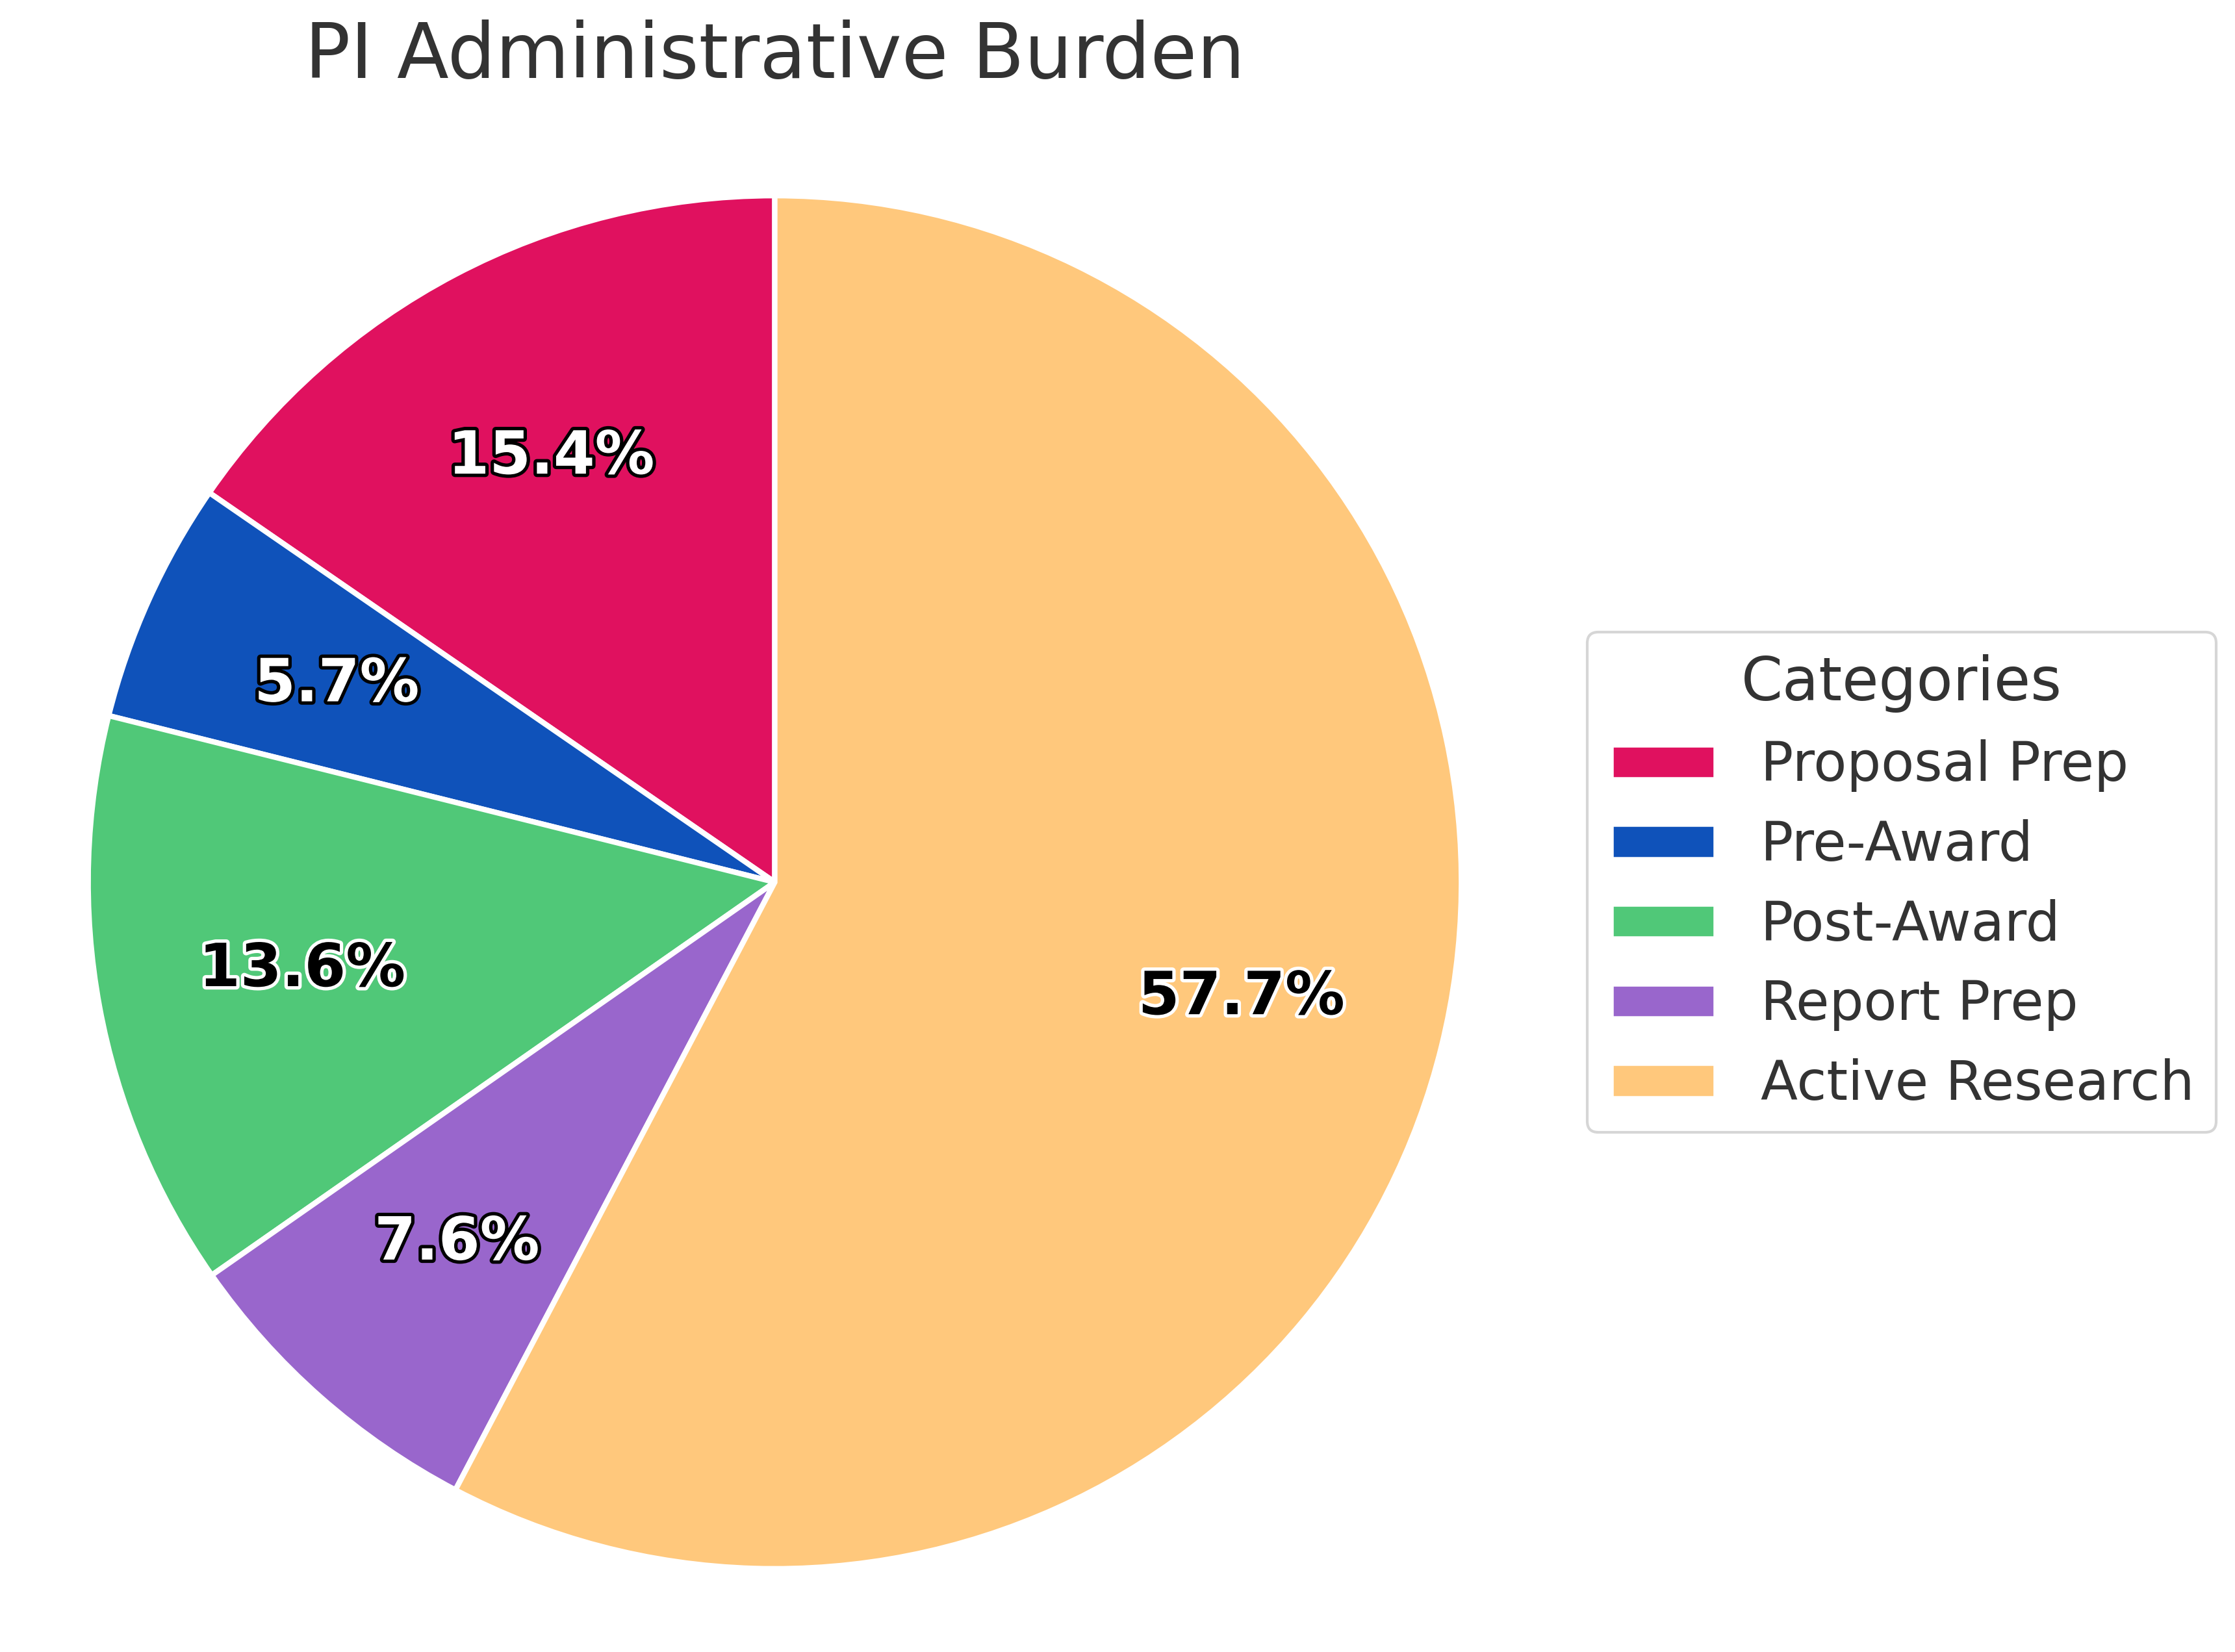
The Current Reality
PI Time Allocation
“PIs estimated that an average of 42% of their research time associated with federally-funded projects was spent on meeting requirements rather than conducting active research.” (FDP 2012)
PI Time Allocation
- 73% (N ≈ 2,200) identify grant preparation time as top challenge (Research Futures 2019)
- Average federal proposal: 116 hours (FDP 2012)
- Success rates were declining under the prior administration with increasing requirements.
- NSF 32% → 26% (2001-2022)
- NIH 32% → 19% (2001-2024)
AI-Native Opportunity
Traditional vs AI-Native
Traditional Approach:
Legacy systems + AI plugins = Limited impact
AI-Native Approach:
AI foundation + Human expertise = Transformative potential
Key Insight:
When AI has complete context from day one, it enables capabilities beyond current imagination
AI-Native Architecture
Core Components
- Foundation: Unified knowledge graph of all research data
- Core Engine: LLMs trained on successful proposals + agency requirements
- Intelligence Layer: Predictive matching, auto-completion, compliance checking
- Human Interface: Conversational UI that preserves researcher voice
Responsible AI Design
"AI should amplify human intelligence, not replace human judgment"
- Transparency: Every AI suggestion traceable to source data
- Human Agency: Researchers maintain full control and authorship
- Fairness: Bias detection and mitigation built into core algorithms
- Privacy: Federated learning keeps sensitive data local

Transformative Use Cases
Target: 40% Proposal Time Savings
- Intelligent Proposal Assembly:
Smart pre-population from research history - Collaborative Discovery:
AI identifies optimal team compositions - Predictive Compliance:
Real-time validation against 50,000+ parsed requirements - Strategic Planning:
Department-wide research portfolio optimization
Network Effects
Growth Phases
Phase 1:
Individual productivity gains (targeting 40% time savings)
Phase 2:
Institutional intelligence (portfolio optimization)
Phase 3:
Network emergence (cross-institutional collaboration)
Future:
AI that can suggest entirely new research directions
Quality Over Quantity
| Dimension | Year 1 | Year 2 | Year 3 |
|---|---|---|---|
| Pilot campuses onboarded | 3 | 7 | 10 |
| Total users (researchers + admins) | 100 | 1,000 | 10,000 |
| Commons artifacts (shared knowledge) | 500 | 2,000 | 5,000 |
| Mean admin minutes/proposal | Baseline | -10% | -15% |
| Responsible AI audit coverage | 90% | 100% | 100% |
| Visual focus | 3 richly detailed institutional nodes; dense intra-campus clusters | 7 nodes with thicker, meaningful inter-campus edges; shared “Commons Cloud” | Dense, specialized mesh with visible domain clusters; constellation of active users |
Network Effects by Year
| Dimension | Year 1 | Year 2 | Year 3 |
|---|---|---|---|
| Depth highlights | Named researcher networks by department/lab; first cross-institutional citation surfaced | AI discovers 47 potential collaborations; 12 proposals submitted, 7 funded; 3-hop paths (Nebula Graph) | Research clusters by domain; OSS contributions flow back; specialization by institution |
| Small-world intuition | Tight intra-campus clustering (physics-like group structure) | Short-path discovery expands (5–6 hops typical) | System-wide small-world acceleration; faster idea diffusion |
| Predictive intelligence | Foundations in place (data model, features) | Collaboration prediction validated (AUC up to ~0.84 in physical/engineering domains) | Mature AI-native workflows embedded in ops + science discovery |
| Quality over quantity | Fewer but deeper intra-campus ties; first meaningful cross-campus link | Fewer, thicker inter-campus ties annotated with outcomes (e.g., $ grants, shared methods) | High-value, specialized ties; fewer but more impactful cross-institutional programs |
| Time returned to science | — | ~10% reduction in admin friction | ~15% reduction ≈ 150,000 hours returned |
| Commons flywheel | Seed set of 500 artifacts | 2,000 artifacts as shared resource cloud | 5,000 artifacts; community reuse and method propagation |
| FOSS/community signal | Internal pilots; initial repo scaffolding | Contributors start appearing beyond pilot institutions | Sustained external contributors; upstream improvements integrated |
| Evidence notes (footer) | Higher clustering within institutions | Small-world path lengths ~5–6; domain-dependent predictability | Power-law-like hubs may emerge (caveat: not universal) |
Implementation Approach
Deployment Strategy
- Core Platform:
Open-source foundation with community governance - Deployment Model:
Cloud-native with on-premise options - Integration Strategy:
API-first design for existing systems - Timeline:
6-month pilot → 18-month rollout → Full deployment
Early Implementation Goals
Expected Outcomes
Efficiency Target:
Reduce admin time from 42% to ≤20% within three years
Collaboration Enhancement:
Increase cross-institutional teams based on AI matching
Funding Success:
Improve proposal competitiveness through intelligent assistance
Community Growth:
Build sustainable open-source ecosystem
The Partnership Opportunity
What We Need
- Letters of Intent from forward-thinking institutions
- Beta testing partners across diverse research portfolios
- Feedback on integration requirements
- Champions who see the transformative potential
What You Get
- Early access to shape the platform
- Significant cost savings vs. commercial solutions
- Voice in governance and roadmap
Addressing Concerns
Common Questions
"Will AI write generic proposals?"
No—it amplifies YOUR voice
"What about data security?"
Federated design keeps data local
"How is this different from [Vendor X]?"
Built by researchers, for researchers
"What if the AI makes mistakes?"
Human-in-the-loop always
The Broader Impact
Evidence-Based Impact
- Equity: First-generation researchers face funding gaps (Estrada et al. 2018); targeted support improves outcomes (NSF ADVANCE 2022)
- Productivity: Admin burden negatively correlates with publication output (Lee & Bozeman 2005)
- Innovation: Efficient R&D spending links to national competitiveness (NSB 2024; OECD 2023)
- Access: Free tier for MSIs, PUIs, and tribal colleges
Technical Deep Dive
Architecture Details
- Data Layer:
GraphDB with semantic research ontology - AI Stack:
Fine-tuned LLMs + retrieval-augmented generation - Security:
Zero-trust architecture with end-to-end encryption - Scalability:
Kubernetes-orchestrated microservices - Interoperability:
ORCID, DOI, NSF IDs native integration

Join In
Next Steps
LOI:
Letters of Intent by Friday, August 8, 2025
Commitment Level:
Beta testing 2-3 departments
Feedback Cycles:
Monthly input on development
Success Metrics:
Define together what transformation looks like
Point of Contact:
Dr. Karin Scarpinato (kscarpin@kennesaw.edu)
Closing Vision
The Future of Research Administration
Today: Researchers spending 42% of time on administration
Goal: Reduce admin burden to ≤20% through AI assistance
Vision: Research administration that enables rather than impedes discovery
Researcher View
Thank you
Questions?
References (1 of 2)
B. Alberts, M.W. Kirschner, S. Tilghman, & H. Varmus, Rescuing US biomedical research from its systemic flaws, Proc. Natl. Acad. Sci. U.S.A. 111 (16) 5773-5777, https://doi.org/10.1073/pnas.1404402111 (2014).
Deakin, Gemma; Mulligan, Adrian; Herbert, Rachel (2019), “Research Futures - survey of researchers”, Elsevier Data Repository, V1, doi: 10.17632/w6mj4tmkxp.1
Estrada M, Burnett M, Campbell AG, et al. Improving Underrepresented Minority Student Persistence in STEM. CBE Life Sci Educ. 2016;15(3):es5. doi:10.1187/cbe.16-01-0038
Federal Demonstration Partnership. 2012 Faculty Workload Survey: Research Report. Washington, DC: Federal Demonstration Partnership, 2014. https://sites.nationalacademies.org/cs/groups/pgasite/documents/webpage/pga_087667.pdf.
Lee, Sooho & Bozeman, Barry. (2005). The Impact of Research Collaboration on Scientific Productivity. Social Studies of Science. 35. 673-702. 10.1177/0306312705052359.
References (2 of 2)
National Academies of Sciences, Engineering, and Medicine. 2016. Optimizing the Nation's Investment in Academic Research: A New Regulatory Framework for the 21st Century. Washington, DC: The National Academies Press. https://doi.org/10.17226/21824.
National Science Board, National Science Foundation. (2024, March 13). Science and Engineering Indicators 2024: The State of U.S. Science and Engineering (NSB-2024-3). National Science Foundation. https://ncses.nsf.gov/pubs/nsb20243
National Science Foundation. NSF FY 2023 Performance and Financial Highlights. Publication 24-003. Alexandria, VA: National Science Foundation, Office of Budget, Finance and Award Management, March 11, 2024. https://www.nsf.gov/reports/performance/nsf-fy-2023-performance-financial-highlights.
National Institutes of Health, Office of Extramural Research. NIH Data Book: Success Rates and Funding Rates, 2001–2022. Updated March 1, 2024. Bethesda, MD: National Institutes of Health. Accessed August 5, 2025. https://report.nih.gov/nihdatabook/category/10.
National Science Foundation. Agency Equity Action Plan. Alexandria, VA: National Science Foundation, January 2022. https://assets.performance.gov/cx/equity-action-plans/2022/EO%2013985_NSF_Equity%20Action%20Plan_2022.pdf.
OECD (2023), Main Science and Technology Indicators, Volume 2022 Issue 2, OECD Publishing, Paris, https://doi.org/10.1787/1cdcb031-en.